
High-resolution weather forecast maps

TowerCheck Paper 
AI models for damage detection on high-voltage power grids using satellite radar imagery ...
ESA Fringe 2026
ESA Fringe 2026 workshop, Krakow, Poland, 15-19 June 2026 ...
Quantum Master @UNIBA
Quantum innovation meets Earth Observation.
GAP - 20 Years Together
A journey of vision, people, and shared growth.
RETURN 2026 - Infrastructure Safety
MT-InSAR monitoring of bridges and tunnels within the ARTEMON-BT project, Intesa Sanpaolo Skyscraper, Turin (Italy), 15-16 January 2026.
VH-RODA 2025
6th Very High-resolution Radar & Optical Data Assessment Workshop, ESA-ESRIN, Frascati (Rome, Italy), 17-21 november 2025 ...
DOTS4IT Final Event
Results dissemination - October 2025
GAP-UNIBA Meeting
Project update - October 2025
DOTS4IT Task 2
Task 2 completed - September 2025
SIET Conference
DOTS4IT presentation - September 2025
Quasimodo Workshop
GAP presents DOTS4IT - September 2025
DOTS4IT Task 1
Task 1 completed - June 2025
DOTS4IT seminar
GAP at Politecnico di Bari - May 2025
DOTS4IT Meeting
GAP & UNIBA meeting - March 2025
MasterQuantum
The Master in Quantum Science & Technology is now starting ...
DOTS4IT Kick-Off
Project launch - October 2024
Follow us on



Products  Meteorological services High Resolution Forecast Maps
GAP provides run operational weather prediction using limited area models (LAM) with appropriate resolutions and grid configurations. At present, this production is applied to a configuration with two nested grids with a domain that contains the entire national territory (res. 10km) and a domain-centered Puglia (res. 2km max), for short and medium range weather conditions forecast.
The same procedures can be adopted for operational runs in other areas in Italy and abroad. For this local short term forecast, GAP can provide hourly maps, at different vertical levels, of various atmospheric fields such as:
• temperature
• wind
• precipitation
• pressure
• cloud cover
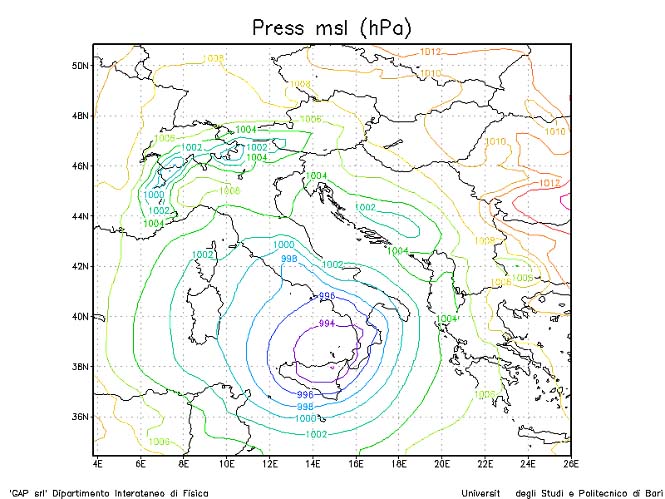
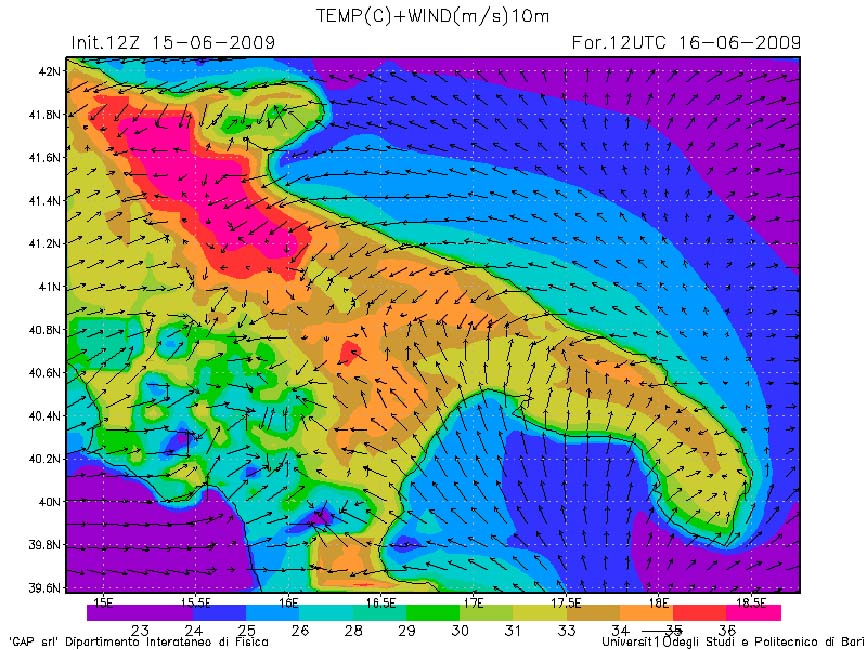

Hourly forecast maps of sea leve pressure (left) on the national domain and of wind filed (right) on the regional domain